
The NWSL is at the halfway mark. Well, for the most part.
Due to two COVID-19 postponements and the Challenge Cup final, the North Carolina Courage actually has only played nine matches, and NJ/NY Gotham FC has played 10. However, most teams are neatly in the 11- to 13-match bracket.
Chaotic scheduling aside, it is a great moment to look at some data trends and patterns that might give us a better understanding of the teams. So, this week, I crunched the numbers to try and make sense of the Houston Dash’s statistical performance at midseason.
Overperforming xG
For me, the most eye-catching aspect of Houston’s data is goals (G) minus expected goals (xG). The Dash currently ranks second in the NWSL for that statistic, with +0.49 G-xG per 90 minutes or +6.91 overall on the season so far. The only team with a higher score is the Portland Thorns, with +0.53 per 90 minutes.
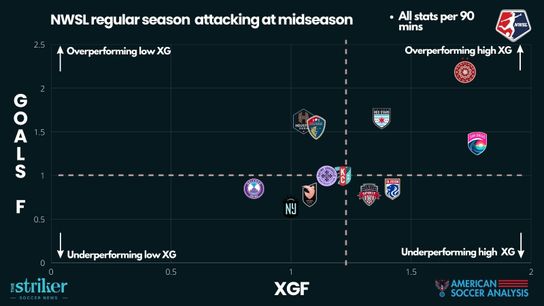
In this chart (above), you can see the quadrants of G-xG performance in the NWSL. The closer a team is to a corner, the more drastic their G-xG is in either a positive or negative way. The dotted lines represent the NWSL average. The horizontal line is for the league's goals scored per match average, while the vertical line is the expected goals scored per match average.
What becomes clear is that the Dash is an above-average team at scoring, but a below-average team at being expected to score the chances it creates.
Essentially, Houston is consistently scoring at a rate the computers believe to be highly unlikely from the chances it has created — nearly seven goals more than what the supposed average team would score from those chances in the data model’s opinion.
This is not a totally new phenomenon. When the Dash emphatically beat the Orlando Pride 5-0, I wrote about how Houston actually had less XG than its opponent’s that day. Nichelle Prince’s hat trick in that match was a combination of brilliant skill and maybe a slice of luck, two things that will give you a favorable G-xG score.
The Dash vs. Pride was a notable analytics shock. A presumed anomaly. Even just in terms of overall goal scoring, it was a surprise because Houston had just six goals in five matches before the Orlando match.
But after some more high-scoring matches over the past seven weeks, the Dash now impressively ranks joint second in the NWSL for total goals scored and goals scored per 90 minutes with 20 and 1.7 respectively, even though Houston’s xG (13.08) and xG per 90 (1.09) currently ranks ninth in the NWSL.
What’s curious is that as the Dash’s attack has continued to score goals, the xG has not risen accordingly. Houston put four past the Courage from an xG of 0.87 and then netted another four against the Chicago Red Stars with an xG of 1.00. Therefore, those two matches alone equal +6.13 in G-XG.
Sharpshooters
Digging deeper into reasons that could explain Houston’s xG overperformance, something that I thought was pertinent was the Dash’s lack of attempts on goal. Houston ranks eighth in the NWSL for shots taken per 90 minutes with 11.75. Less overall shots mean fewer instances for a team to improve its xG.
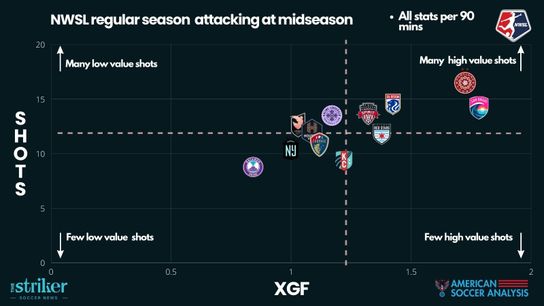
In this chart, you can see how the Dash is an average team in the NWSL when it comes to the number of shots it takes, and that those shots are not considered to be converted into goals.
In comparison, the Red Stars attempt the same amount of shots as the Dash and have a higher xG and the Kansas City Current actually shoots less often than the Dash but has a higher xG.
Furthermore, when it comes to what Opta defines as big chances created, Houston is again down the NWSL rankings. The Dash is seventh for that category with just 1.3 big chances created per 90 minutes. Unsurprisingly, the Thorns are first for big chances created per 90 minutes with 2.2, almost twice as many per match as Houston.
Another metric that helps compound the idea that Houston doesn't create a large number of chances is possession. The Dash is dead last in the NWSL for average possession per match with 44.3%. Less of the ball can often mean fewer chances.
Even without all the data presented this way, there's evidence of this in Houston's matches. Thinking back to Ebony Salmon’s hat trick in the Dash’s 4-1 over the Red Stars, she attempted just four shots and scored three of them. The Englishwoman was lethal, almost perfect on the night, as sharp as any forward can be in this league.
Zooming in on efficiency, it becomes clear Houston is an elite team at taking the chances that are presented to them. Salmon currently ranks first in the NWSL amongst forwards in her shot-to-goal conversion rate with 33%. Prince is second with 28%, and Rachel Daly is ninth with 18%.
In the second half of the NWSL season, the challenge becomes whether the incredibly efficient Dash forwards can keep this up? Right now, the Houston frontline is showing the data models up. Salmon and Prince are trying to tell you that xG is for nerds.
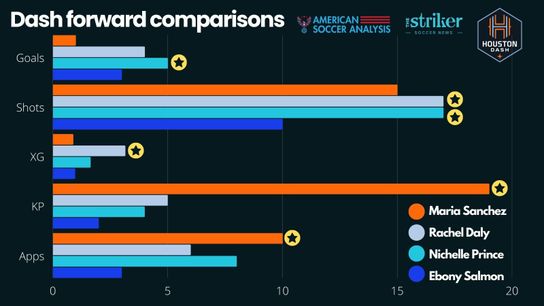
This chart (above) shows you a statistical comparison of the Dash's four key forwards at the midseason point. The only real outlier is that Maria Sanchez — who has played a deeper and wider role than the other three — clearly offers more as a creative force. Her 19 key passes (KP) in 2022 dwarfs her teammates' contribution in that department.
Internationals will return
While getting deep into the Dash's data over the first half of the season is insightful, I also think it's important to acknowledge there are going to be changes to the trends in Houston.
For one, Juan Carlos Amoros is the interim head coach now. That means potential tweaks to tactics, personnel preferences and patterns of play. Sunday's match against Gotham will be his first away match and should give us plenty of new things to examine.
There's also the bounty of international players that have been trickling back into the squad. Michaela Abam and Michelle Alozie returned to training this week from the African Cup of Nations. Sanchez, Prince, Allysha Chapman and Sophie Schmidt also returned from CONCACAFW. The only player still away is Daly, who is with England at the UEFA European championships.
A data point that can show us the value of these players to Houston is the goals for and against +/- when they are on and off the pitch. Understandably the top four players for Houston for +/- are Sanchez, Prince, Daly and Schmidt. The Dash are +8 goals better off with that quartet on the pitch.
Bait and tackle
Having spewed a lot of thoughts and data on Houston's attack I do want to close out with a few remarks on the defensive side of the ball. For 11 matches of the season, the Dash excelled as a defensive team under first assistant Sarah Lowdon.
At midseason, the Dash ranks first in the NWSL for successful tackles per match with 15. Backing that up on an individual level, the top two players in the NWSL for that statistic are Bri Visalli and Elizabeth Eddy with 3.9 and 3.3 per match respectively.
Lowdon's 3-4-1-2 allowed to Eddy roam all over the pitch and be a very effective wing back, never afraid to engage in a duel or make a late run into the box from a wide area. After starting out as more of a winger in Houston, Visalli has transitioned into being a useful disruptor coming off the bench during the 2022 season.
Interestingly, although Houston ranks first for interceptions in the NWSL, with 12.3 per match, it actually only has one player in the top 10 for interceptions per match. That is Schmidt, who averages 2.2. This could suggest that Houston works very well as a team to block passes and create turnovers, rather than one player having a standout talent.
Of course, more time off the ball does mean more opportunities to tackle and intercept your opponent. But while good tackling and interceptions make a lot of sense, considering the Dash's average possession is only 44.3%, the Dash does deserve credit for committing only the eighth most fouls (10.7 per match) despite having to do a lot of defending.
For the most part, Houston has not cracked under pressure so far this season. The only match that comes to mind is the 4-0 loss to Portland at PNC Stadium.
One more thing to keep an eye on as the second half of the Dash's season gets underway is more turnovers in the opponent's third of the pitch.
Amoros appears to be very focused on the Dash being a pressing team. At midseason, Houston ranks 10th for winning possession in the opponent's territory. I would be amazed if Amoros' team stays that far down the rankings.
Against the Red Stars, Salmon and Shea Groom showed their prowess for being threats in high-pressing situations. When Daly returns to the team that element of the Dash's game could get even more potent. The Englishwoman currently is 12th in the NWSL for turnovers in the opponent's third with 1.7 per match.